How long does a thermal inspection of a 10 MW solar park take?
Published on 9 min read
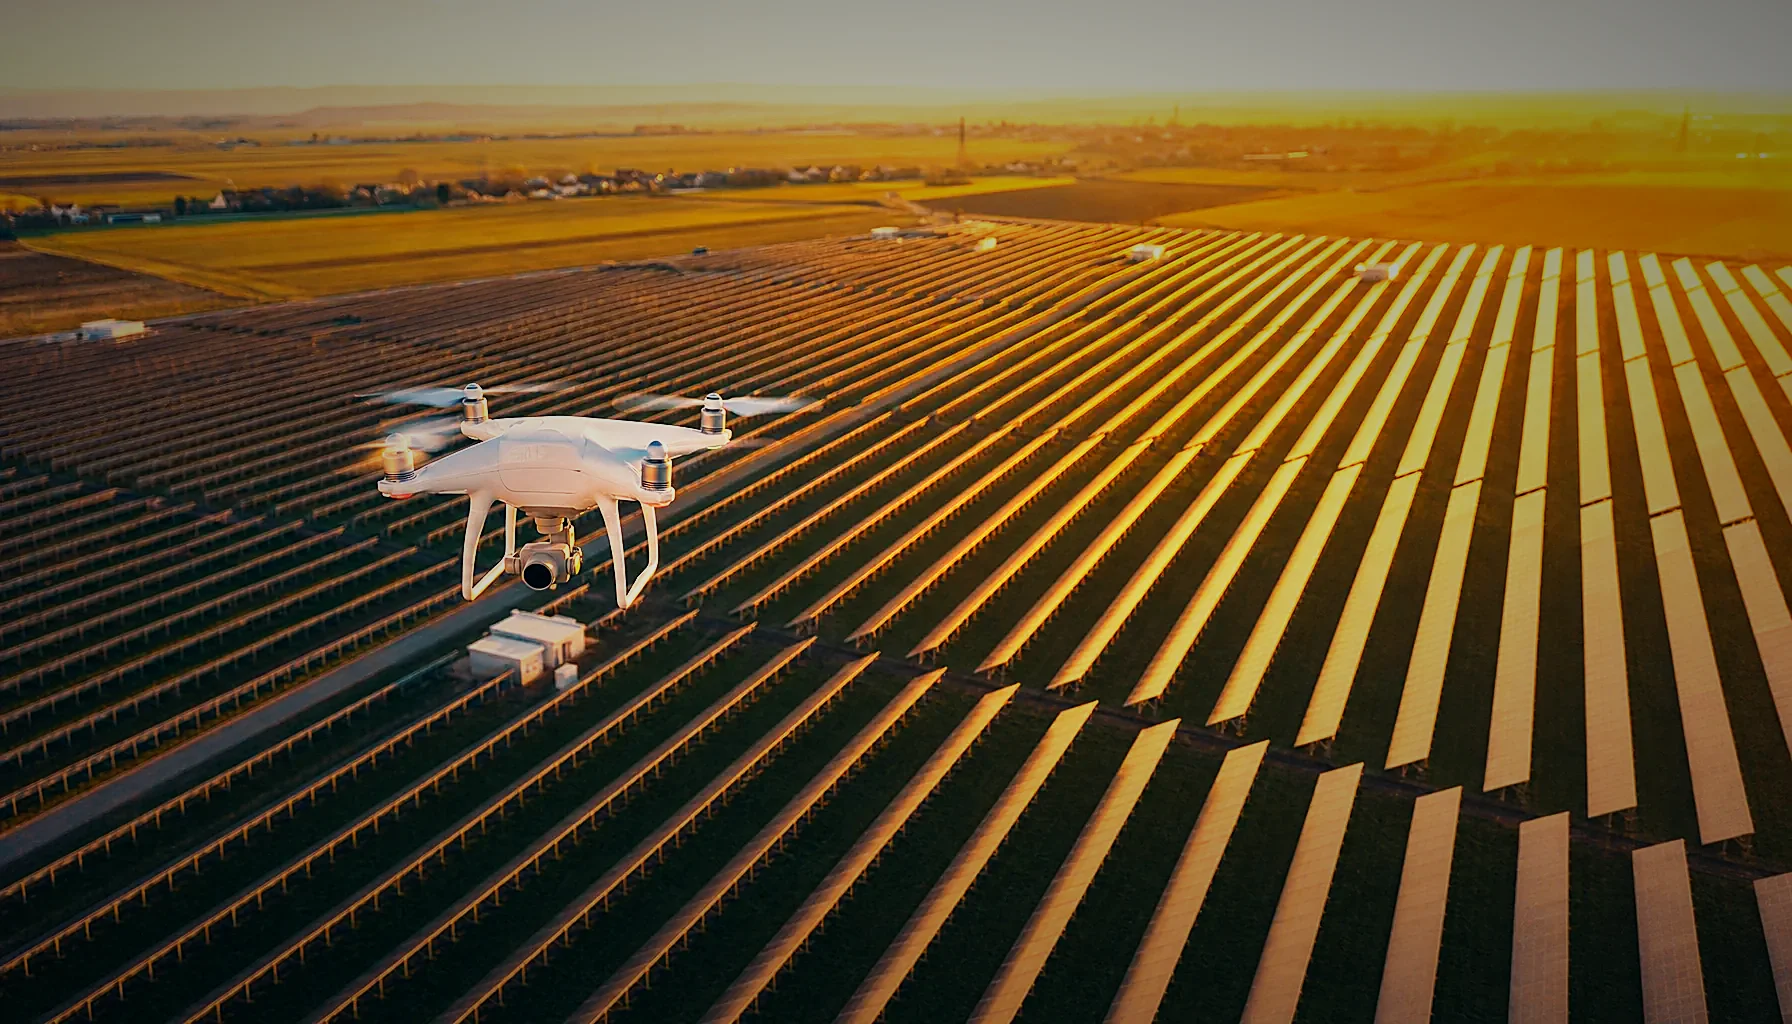
A thermal inspection of a 10 MW solar park takes one flying day in most cases — roughly 2 to 4 hours of airtime inside the irradiance window, plus up to 5 working days for analysis and the report. Weather, terrain and the requested GSD shift that figure.
How long does a thermal inspection of a 10 MW solar park take in practice?
Plan one day on site. A 10 MW ground-mounted plant covers around 15 to 25 hectares of module area, which a radiometric drone covers in 2 to 4 hours of flying when irradiance stays above the threshold and the wind stays inside limits.
That day splits into three blocks. Site arrival, briefing and perimeter check take 45 to 60 minutes. Flying runs in automated grid missions, with battery swaps every 20 to 25 minutes.
Coverage verification before leaving the site takes another 30 to 45 minutes. We check image count against the planned flight lines, confirm overlap on a sample strip, and confirm that every string table appears in the dataset. If a block is thin, we refly it the same day rather than scheduling a return trip.
Two factors stretch a single day into two. The first is a short irradiance window — in winter or on partly cloudy days you may only get 3 usable hours. The second is a high-resolution request: a 2 cm thermal GSD for module-level crack detection means lower altitude, more flight lines, and roughly double the airtime of a standard 3 to 6 cm survey.
Analysis is the part clients underestimate. Anomaly detection, classification and reporting in Scopito for a site up to 20 MW is delivered within 5 working days of the flight, including string-level mapping cross-referenced with the as-built layout when you ask for it. Total elapsed time from mobilization to delivered report: usually about a week.
How big is a 10 MW solar farm and how does area drive flight time?
A 10 MW solar farm occupies roughly 20 to 30 hectares of fenced land, of which 15 to 25 hectares is active module surface. Flight time scales with module area, not with nameplate capacity, so two 10 MW plants can differ by 40% in airtime.
Module technology sets the footprint. A plant built with modern 550 W bifacial modules needs less land per MW than a 2014-era site built with 250 W panels, so an older 10 MW park can be noticeably larger to fly.
Tracker rows change the geometry again. Single-axis trackers mean wider spacing between rows and more empty ground inside the survey polygon, which adds flight lines that return little usable data unless the mission is planned tightly around the module bands.
Terrain is the other multiplier. A flat site in Dolj or Olt flies as a clean grid. A sloped site needs terrain-following altitude control to hold a constant GSD, which reduces effective speed and adds 20 to 30% to airtime.
Rooftop PV behaves differently. A 1 MW commercial rooftop is often faster per MW than a ground mount because the array is dense, but obstacle clearance, airspace near cities and the need for manual segments around HVAC units can eat the saving.
As a planning rule of thumb for Romanian sites: a standard radiometric thermal survey with a DJI Mavic 3T covers up to about 50 MW per flying day in good irradiance, and a 9.5 MW park took about 2 h 15 min on site; expect roughly half of that capacity when the specification calls for a finer GSD or combined thermal plus RGB acquisition in the same pass.
See what a thermal survey delivers
Our solar farm thermal inspection page lists the acquisition conditions, the deliverables you receive and the report turnaround for sites in Romania. Worth a look before you plan your next flying day.
What weather conditions are needed for drone thermography of solar panels?
Thermal inspection of PV modules needs irradiance of at least 600 W/m², clear or evenly overcast-free sky, wind below roughly 6 m/s at module height, and dry panel surfaces. Below 600 W/m² the temperature difference between a healthy cell and a faulty one collapses and anomalies stop being detectable.
IEC TS 62446-3 is the reference document for thermographic inspection of PV plants, and our acquisition follows its recommendations: minimum irradiance, stable conditions, and a measured surface emissivity assumption rather than a default one.
Clouds are the practical enemy. Intermittent cloud cover changes module temperature within minutes, so a dataset flown across moving cloud shadows produces false hotspots and missed ones. We hold the flight until the sky is stable rather than filling the memory card with unusable frames.
Wind matters twice. It cools modules unevenly, which flattens thermal contrast, and it degrades image geometry by forcing the aircraft to tilt. Above that limit we stop.
Time of day narrows the window further. In Romania the usable band is typically 10:00 to 16:00 from April to September, and closer to 11:00 to 14:00 in the winter months, which is why a December survey of a 10 MW park can need two days where a June survey needs one.
Rain, dew and recent cleaning disqualify a flight entirely. Evaporative cooling masks hotspots for 1 to 2 hours after the surface dries. We also avoid flying within 2 hours of a sharp irradiance ramp — early morning on a clear day — because modules have not reached thermal equilibrium.
Because of all this, mobilization in 24 to 72 hours anywhere in Romania is a scheduling advantage, not a slogan. When a 3-day clear window opens over Teleorman, the aircraft can be on site inside it.
What is GSD for a thermal drone and what overlap do PV platforms require?
GSD (ground sample distance) is the real-world size of one pixel on the module surface. For PV thermography, 5 cm GSD per thermal pixel is the common working standard for hotspot and string-level faults, while 2 to 3 cm is requested when the analysis needs cell-level detail such as cracks or PID patterns.
A radiometric 640×512 thermal sensor on a DJI Mavic 3T reaches about 5 cm GSD at roughly 40 to 45 m altitude, depending on lens and planning software. Lower altitude gives finer GSD and costs airtime, which is the whole trade-off behind any inspection quote.
Overlap defines whether the dataset can be stitched and georeferenced. PV analytics platforms and pilot networks commonly specify 85% front overlap and 65% side overlap for thermal datasets, and we fly to the platform’s own specification rather than to a generic default.
Those two numbers interact. Raising front overlap from 70% to 85% adds captures per flight line and shortens battery endurance, so a specification change from one platform to another can add an hour or more to a 10 MW survey.
EXIF integrity is non-negotiable for platform ingestion. Every frame is delivered with GPS coordinates, altitude, timestamp, camera model and radiometric metadata intact, because platform pipelines use that metadata to place anomalies on the plant layout.
For geometric work we add PPK corrections through ROMPOS, which brings photogrammetric accuracy to the centimetre level. That matters when the thermal anomaly map must align precisely with an as-built CAD layout or when volume and layout verification is part of the same mobilization.
What do you receive after a drone thermal inspection of a PV plant?
You receive a PDF inspection report, an anomaly list with coordinates and classification, a thermal and RGB orthomosaic of the plant, and the complete raw dataset with EXIF and GPS intact. Delivery goes either through the platform’s own uploader or in the folder structure requested in the brief.
The report is the readable layer. It lists each anomaly with its thermal signature, severity class, module position, radiometric temperature delta and a paired RGB image so a field technician can find the module without guessing.
The orthomosaic is the spatial layer. A thermal orthomosaic of the full 10 MW site lets an O&M lead see clustered faults — a whole string offline, a shaded block, an inverter-level pattern — rather than isolated points.
The raw dataset is the audit layer. Investors, technical advisors and warranty claims against module manufacturers need original radiometric frames, not screenshots, so we hand over everything acquired.
Anomaly classification in Scopito follows the categories O&M teams act on: single-cell hotspot, multi-cell hotspot, bypass diode failure, substring open circuit, full module offline, string offline, soiling, vegetation shading, physical damage and junction box heating.
For platforms and pilot networks, the handover looks different again. We fly to the acquisition specification, name files to the convention supplied, and upload the dataset directly, with one technical contact from brief to delivery so nobody re-explains the site twice.
Planning an inspection for your plant?
Check the irradiance limits, GSD options and report timelines we work to for PV plants from 1 MW upwards. Tell us your site size and we will fit it into the next clear window.
How often should a solar park be inspected with a thermal drone?
Inspect once a year as a baseline, and twice a year for plants under performance warranty or sites with a known defect history. An annual thermal survey is the standard interval referenced in O&M contracts and lender technical reviews across 2025 and into 2026.
Commissioning is the other fixed point. A thermal and visual inspection at handover documents module condition before the EPC warranty period starts, and that dataset becomes the comparison baseline for every later survey.
Event-driven inspections sit outside the schedule. Hail, heavy storms, grid faults, fire incidents and sudden yield drops justify a survey within days, which is where mobilization in 24 to 72 hours anywhere in Romania changes what you can recover.
Repeat surveys get more valuable over time. Comparing the same plant year over year shows anomaly progression — a single-cell hotspot that becomes a bypass diode failure — and that trend is what supports a module replacement claim.
Timing inside the year matters too. Early summer gives the longest irradiance window and the cleanest data, while a late-season survey catches soiling and vegetation growth that the spring flight would have missed.
Finding a local operator is simpler than it looks: check that pilots hold EASA open category A1/A3 and A2 certificates, that acquisition follows IEC TS 62446-3 recommendations, and that the deliverable list includes raw radiometric frames and not only a PDF. Those three checks eliminate most of the risk of a dataset a platform cannot ingest.
Frequently asked questions
How much does a thermal imaging inspection typically cost?
Cost depends on plant size, requested GSD, whether RGB is acquired in the same pass, and the depth of analysis and reporting. A 10 MW ground-mounted survey is priced as a single mobilization plus analysis, while multi-site portfolios are quoted per MW. Send the plant capacity, location and the platform specification you need, and request a personalized quote.
How big is a 10 MW solar farm?
A 10 MW solar farm typically occupies 20 to 30 hectares of fenced land, with 15 to 25 hectares of active module surface. The footprint depends on module wattage, row spacing and whether the plant uses fixed-tilt or single-axis trackers. Older plants built with 250 W modules need noticeably more land per MW than plants built with 550 W bifacial modules.
What irradiance is required for a thermal inspection of PV modules?
Thermal inspection of PV modules requires a minimum irradiance of 600 W/m² measured in the plane of the array. Below that level, the temperature difference between a healthy cell and a faulty one becomes too small to detect reliably, which produces missed anomalies. In Romania the dependable window runs from about 10:00 to 16:00 between April and September.
What accuracy can drone photogrammetry reach with PPK?
Drone photogrammetry with PPK corrections reaches centimetre-level absolute accuracy. We apply PPK through the ROMPOS network, which allows the orthomosaic, 3D model and point cloud to be aligned to the national coordinate system without a dense network of ground control points. That accuracy is what lets a thermal anomaly map overlay an as-built CAD layout module by module.
Related services
Thermal and visual drone inspections
Roofs, facades, industrial halls, power lines and wind turbines inspected from the air, with an annotated report and a ranked defect list.
See the service
Solar farm thermal inspection
Radiometric thermal and RGB survey of PV plants, with every anomaly classified and located by string and module. Report in 5 working days for plants up to 20 MW.
See the service
Tell us about your site
Send the location, the size and the deliverable you need. We reply with a written quote and a proposed flight window.
- Reply within 24 h on working days
- Written quote, no obligation
- Your data stays confidential
Reply within 24 h on working days. Written quote, no obligation.