What do I receive after a drone thermal inspection of a PV plant? A complete guide to deliverables
Published on 10 min read
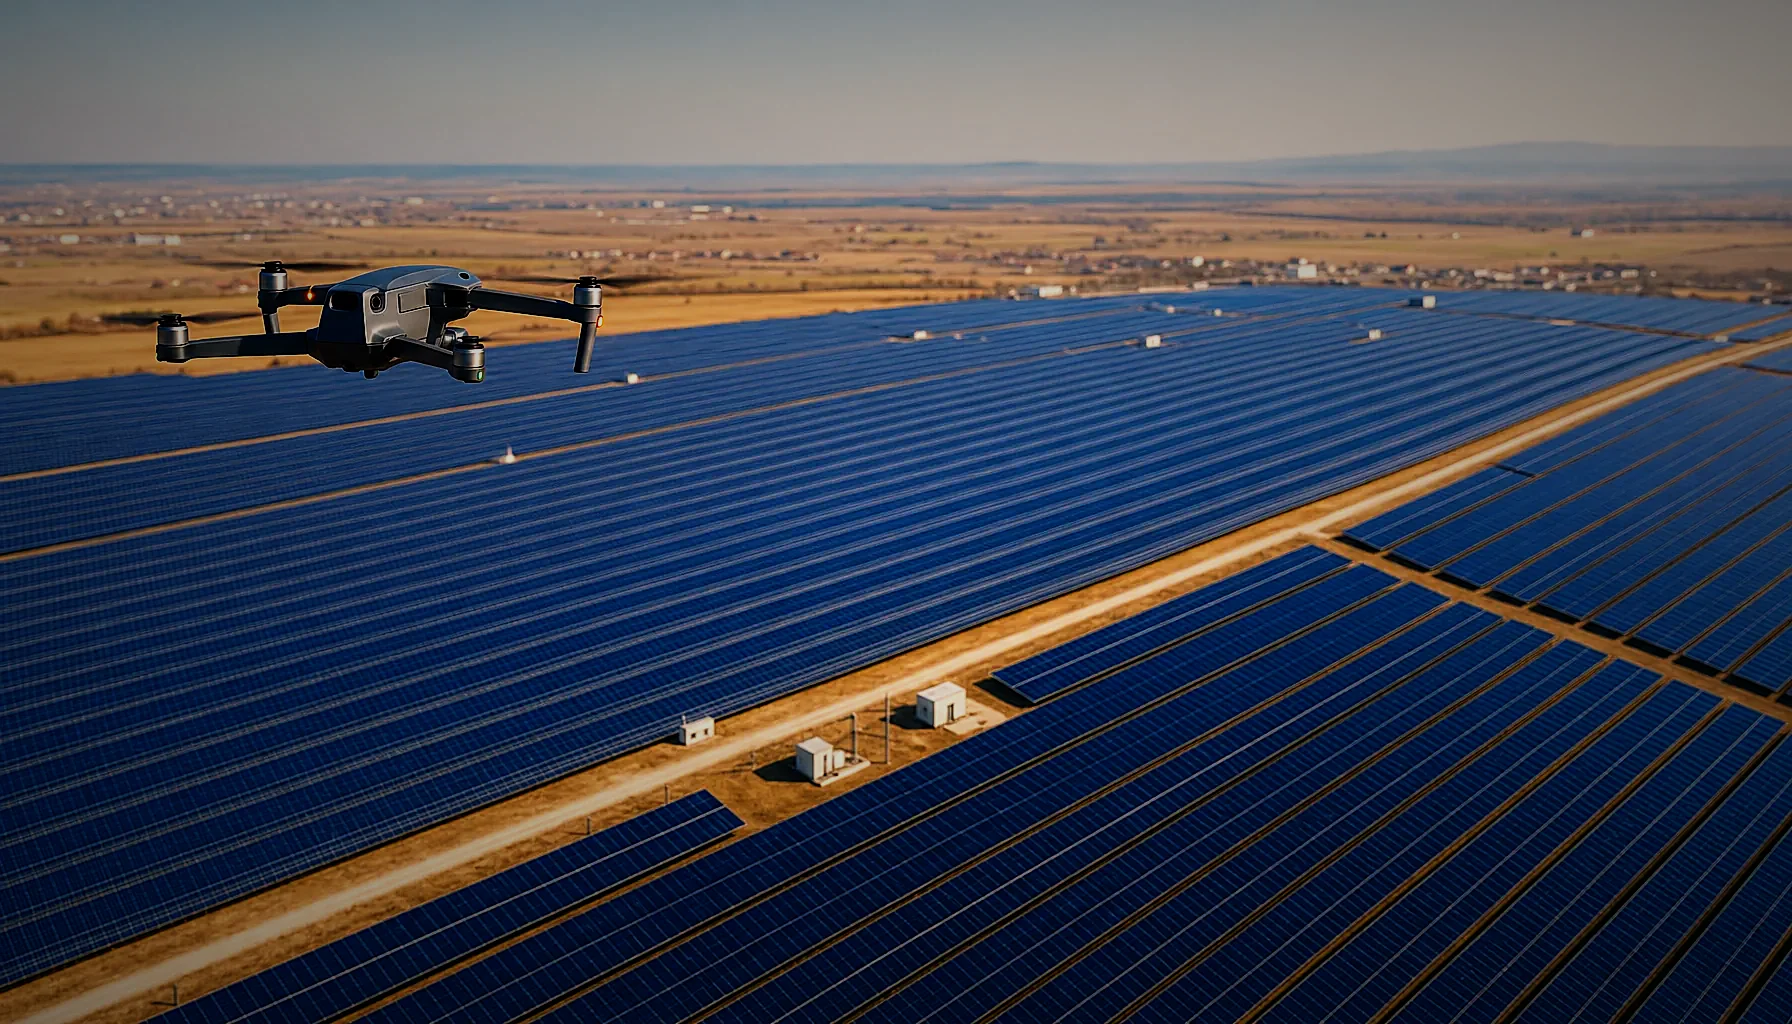
After a drone thermal inspection of a PV plant you receive a PDF inspection report, a list of anomalies with their exact position in the plant, thermal and RGB images of every defect, and the complete raw dataset with EXIF and GPS intact. Most clients also receive a thermal orthomosaic of the site and a web viewer link.
What exactly is in the deliverables of a drone thermal inspection of a PV plant?
The standard delivery package contains five items: the PDF report, the anomaly list in a spreadsheet, the thermal and visual image pairs for each anomaly, the thermal orthomosaic, and the raw flight dataset. Each item answers a different question for a different reader in your organisation.
The PDF report is written for the asset manager and the investor. It states when the plant was flown, the irradiance and ambient temperature during the flight, the equipment used, the number of modules covered, and a summary table of anomalies by class and severity.
The anomaly list is written for the O&M crew. Every row carries an anomaly ID, the anomaly class, the delta T in kelvin, the GPS coordinates, and the string or table reference so a technician can walk to the module without guessing.
The image pairs are the evidence. For each anomaly you get the radiometric thermal frame in the ironbow palette and the matching RGB frame at 48 MP, so a hotspot can be checked against visible soiling, shading, cracked glass or a loose connector.
The thermal orthomosaic is the overview. It stitches the thermal frames into one georeferenced image of the whole plant, which makes layout-level patterns obvious: a whole inverter block running warm, one row shaded by vegetation, a table with repeated bypass diode failures.
The raw dataset is your insurance against being locked in. It contains the original radiometric images with EXIF and GPS metadata untouched, the flight logs and the mission parameters, so any analytics platform you work with can re-process the data later.
What does the PV thermal inspection report contain, section by section?
A PV thermal inspection report follows the structure recommended by IEC TS 62446-3: survey conditions, equipment, method, findings by anomaly class, and recommended action. In our reports that is typically 15 to 40 pages for a plant of 10 to 20 MW, depending on how many anomalies are found.
Section one records conditions. Irradiance must be at least 600 W/m² for a valid thermographic survey under IEC TS 62446-3, and the report states the measured value, wind speed, ambient temperature and cloud state at the start and end of each flight.
Section two records equipment and method. For most missions this is a DJI Mavic 3T with a radiometric 640×512 thermal camera and a 48 MP RGB camera, flown at a fixed altitude and speed that keeps the thermal ground sample distance inside the platform specification.
Section three is the findings table. Anomalies are grouped by class — single hotspot cell, multi-cell hotspot, bypass diode or substring failure, whole module open circuit, string offline, junction box heating, soiling and shading — each with a count and a share of the inspected modules.
Section four is the per-anomaly detail. Each entry shows the thermal and RGB image, the delta T, the coordinates, and the severity class that drives priority. A string-level failure goes to the top of the list; a single cell hotspot at 3 K goes on the watch list.
Section five is the recommended action. The wording stays technical: clean, re-torque, replace module, investigate inverter channel, cut back vegetation. The report does not price the work — it tells your O&M contractor what to look at and in what order.
See what a PV thermal inspection delivers
Our solar farm thermal inspection page lists the acquisition conditions, the full deliverable package and how fast the report comes back. Worth a look before you brief your next survey.
How are drone datasets delivered to a PV analytics platform?
Datasets are delivered the way the platform asks for them: through the platform’s own uploader, through a shared cloud folder in the platform’s folder structure, or on physical media for very large missions. The images keep their original EXIF and GPS metadata in every case.
Before the flight we take the platform’s acquisition specification and fly to it. A typical thermal specification is 6 cm GSD with 85% front overlap and 65% side overlap, a fixed heading per row, and no auto-gain changes mid-row — small details that decide whether a dataset passes ingestion.
Coverage is checked on site before the crew leaves. A gap in the middle of a 70 ha plant is cheap to fix while the drone is still on the ground and expensive to fix three days later from Bucharest.
For platforms that run their own analytics, we often deliver acquisition only: raw radiometric images, flight logs, and a coverage map, with the anomaly classification done inside the platform. For asset owners without a platform, we run the analysis ourselves and deliver the report and the web viewer.
Folder naming matters more than people expect. Files arrive in the structure the platform specified — per flight, per row, or per inverter block — because a dataset that needs manual re-sorting costs the receiving team hours.
If you work with a pilot network, the acquisition brief usually arrives as a PDF with altitude, speed, overlap, irradiance window and metadata rules. We fly to that brief and report back against it, line by line, so the mission can be signed off without a second site visit.
Report, anomaly list or raw dataset — which deliverable do you actually need?
Choose by who reads the output. Investors and lenders need the PDF report, O&M crews need the anomaly list with coordinates, and analytics platforms need the raw dataset. Most plants in 2026 are inspected with all three delivered together, because they cost almost nothing extra once the flight is done.
| Deliverable | Who uses it | What it answers | Typical format |
|---|---|---|---|
| PDF inspection report | Asset manager, investor, lender | Plant health, conditions of survey, compliance with IEC TS 62446-3 recommendations | PDF, 15-40 pages |
| Anomaly list | O&M contractor, site technician | Where each defect is and what to do first | XLSX or CSV with GPS |
| Thermal and RGB image pairs | Engineering, warranty claims | Visual proof of each anomaly | JPG / radiometric TIFF |
| Thermal orthomosaic | Asset manager, EPC | Patterns across blocks and rows | GeoTIFF + web viewer |
| Raw dataset | PV analytics platform | Re-processing, trend comparison year on year | Original images, EXIF and GPS intact |
For a warranty claim you need the image pairs and the radiometric files, not a summary. Module manufacturers ask for the original radiometric frame so delta T can be verified independently.
For year-on-year trending you need the raw dataset archived. An anomaly that was 4 K last season and 11 K this season tells a different story from a single snapshot, and only the raw data lets you compare properly.
For a plant you are about to buy, the orthomosaic plus the report is usually enough for due diligence, with the raw dataset held in reserve if the numbers are disputed.
How long does it take to receive the deliverables, and what drives the timeline?
Report turnaround is 5 working days for parks up to 20 MW, counted from the last flight day. Mobilisation anywhere in Romania takes 24 to 72 hours, and a quote is returned within 24 hours on working days.
Flight time is rarely the bottleneck. A roughly 10 MW solar park is flown on site in about 2 h 15 min, and on a day of good irradiance we cover up to about 50 MW. Our largest mission in 2026 was about 60 MWp over about 70 ha, completed in one or two flight days.
The weather window drives the calendar. Thermography needs at least 600 W/m² irradiance, stable cloud conditions and low wind, which is why mobilisation is planned against a forecast rather than a fixed date. If you want the full timing breakdown, see our guide on how long a thermal inspection of a 10 MW solar park takes.
Analysis time scales with anomaly count, not only with megawatts. A clean 20 MW plant with 40 anomalies is reported faster than a 12 MW plant with 600 anomalies that each need classification and a severity call.
Larger plants extend the schedule proportionally. For a site above 50 MW, or a portfolio flown in one mobilisation, the delivery date is agreed in the brief — contact us for details on a specific portfolio and we will put the dates in writing before the crew moves.
In 2026 we flew over 400 MW of PV capacity in Romania, and the pattern is consistent: the plants that get useful reports are the ones where the acquisition specification was agreed before the drone left the office.
How do you judge whether the deliverables are any good?
Check five things: measured irradiance recorded in the report, thermal GSD, coverage completeness, EXIF integrity, and whether each anomaly has coordinates you can navigate to. If any of the five is missing, the dataset is weaker than it looks.
Irradiance first. A thermal survey flown at 400 W/m² will show fewer and milder anomalies than the same plant at 800 W/m², and a report that does not state the measured value cannot be compared with last season’s.
Then GSD. Thermal ground sample distance decides whether you detect a single cell or only a whole substring. A specification of 6 cm GSD gives reliable cell-level detection; flying higher is faster and finds less.
Coverage completeness is easy to verify. Open the orthomosaic or the coverage map and look for holes — unflown rows at the plant edge and missing frames at row ends are the two most common gaps.
EXIF integrity decides whether the data has a second life. Images stripped of GPS and timestamp by an export tool cannot be georeferenced or re-processed, which quietly destroys the value of the archive.
Finally, navigability. Every anomaly entry should give a technician enough to find the module on a 70 ha site in one walk: coordinates, row, table and position. That is the difference between a report that gets acted on and a report that gets filed.
Planning a thermal survey of your plant?
Check the irradiance window, flight specification and 5 working day turnaround we work to for parks up to 20 MW. Everything is on our solar farm thermal inspection page.
Frequently asked questions
Can a drone inspect solar panels?
Yes — a drone with a radiometric thermal camera is the standard method for inspecting solar panels at plant scale. It detects hotspots, bypass diode failures, offline strings, soiling and shading without taking the plant offline or touching a module. A DJI Mavic 3T with a 640×512 radiometric thermal camera covers a roughly 10 MW park in about 2 h 15 min of flight time.
How much does a drone inspection cost?
The cost of a drone inspection depends on plant size, the acquisition specification and the deliverables you need, so it is quoted per site rather than from a list. A single 10 MW plant with a full report is priced differently from a portfolio flown in one mobilisation. Request a personalised quote and you will have it within 24 hours on working days.
How much does a thermal imaging inspection typically cost?
A thermal imaging inspection is priced by the area or capacity surveyed and by whether you need raw acquisition only or a full analysed report. Acquisition-only missions for a PV analytics platform cost less than missions that include anomaly classification and a PDF report. Send the plant capacity, location and the platform specification, and we return a quote within 24 hours on working days.
What irradiance is required for a thermal inspection of PV modules?
Thermographic inspection of PV modules requires a minimum irradiance of 600 W/m², following the recommendations of IEC TS 62446-3. Below that threshold, temperature differences between healthy and faulty cells are too small to classify reliably. The measured irradiance should always be recorded in the report so surveys can be compared season to season.
How often should a solar park be inspected with a thermal drone?
Once a year is the baseline for a solar park, usually in the high-irradiance months, with a second flight after any hail, storm or major electrical work. Plants under warranty or with known serial defects are often flown twice a year to document progression. Annual inspection also builds the year-on-year dataset that makes degradation visible.
How do I find a local drone pilot for a solar park inspection in Romania?
Look for EASA A1/A3 and A2 certified pilots who can show a sample report, state the thermal GSD they fly at, and deliver complete datasets with EXIF and GPS intact. Ask whether they fly to your platform’s acquisition specification rather than to their own default settings. Drone Data operates from Bucharest and Ilfov with mobilisation anywhere in Romania in 24 to 72 hours.
Related services
Thermal and visual drone inspections
Roofs, facades, industrial halls, power lines and wind turbines inspected from the air, with an annotated report and a ranked defect list.
See the service
Solar farm thermal inspection
Radiometric thermal and RGB survey of PV plants, with every anomaly classified and located by string and module. Report in 5 working days for plants up to 20 MW.
See the service
Tell us about your site
Send the location, the size and the deliverable you need. We reply with a written quote and a proposed flight window.
- Reply within 24 h on working days
- Written quote, no obligation
- Your data stays confidential
We work across Romania, with mobilization in 24–72 h.